How to Debug RP2040 Arduino Projects Using Raspberry Pi Debug Probe & PlatformIO
RP2040 is a feature-rich, versatile, and low-cost microcontroller from Raspberry Pi. It has become the favorite microcontroller of most engineers and makers. We have covered the microcontroller in many previous posts including our getting started tutorial. Even though we explained how you can compile C/C++ projects using the official SDK and the Arduino Development Framework (ADF), we never showed how to debug your RP2040 projects. We can finally show you that using the official Raspberry Pi Debug Probe intended for debugging RP2040 microcontrollers.
We can develop embedded firmware for you
CIRCUITSTATE can develop embedded firmware for any microcontroller/microprocessor including 8051, PIC, AVR, ARM, STM32, ESP32, and RISC-V using industry-leading SDKs, frameworks, and tools. Contact us today to share your requirements.
What is Debugging?
A bug is an issue in a design. A design could be an algorithm, software, mechanical, electronic, and so on. However, the term is mostly used in relation to software and hardware. Debugging is the process of finding and fixing bugs in the design. There is an interesting history behind the origin of the term “bug” which you can read on Wikipedia. Bugs are issues in software/hardware that result in unintended behaviors. Bugs can be caused by human programmers, underlying hardware, or due to random effects (such as bit flips). Since most of the bugs are human-made, they can be fixed through debugging. Ideally, all bugs should be identified and fixed during the testing phase of development. However, conditions in the testing lab may be too ideal and far from the actual deployment environment. Due to that, many bugs only pop up during the actual deployment.
The methods and techniques used for debugging vary depending on what type of system you are trying to debug. You will need specialized tools and methods for each type. The most well-known debugging methods and tools are applicable to software and hardware debugging. In this post will stick with hardware debugging where we will fix bugs on microprocessor/microcontroller-based embedded systems.
If you came here for learning how to use the Pico Debug Probe for debugging the native C/C++ SDK projects, we have a separate tutorial for you.
Debugging RP2040 Pico C/C++ SDK Projects using Raspberry Pi Debug Probe & VS Code
Embedded Debugging
There are many methods and tools for debugging embedded hardware, which are mostly created by the manufacturers of the hardware. A few of the general and well-known methods are,
- Trace Code
- Done by adding extra print statements in the main code. This will print variable or other input-output information to a console.
- Simplest of all techniques.
- Can create overhead to the main code and add latency.
- In-Circuit Debugging
- Carried out with a dedicated tool called In-Circuit Debugger (ICD).
- ICD can access system resources and control its behavior including process pause/resume, stepping through instructions, and inspecting variables and registers.
- A debugger front-end is used to do debugging.
- Probing
- Measuring, logging, and visualizing electrical signals in digital or analog domain.
- Can be done with logic analyzers, protocol analyzers, or oscilloscopes.
- System Dumping
- Dumping system resources such as memory contents to be analyzed later.
- Simulation
- Uses a virtual model of the system to be tested.
- Computationally intensive, complex, and expensive.
- Don’t always replicate real-world conditions.
RP2040
RP2040 is a dual-core ARM Cortex-M0+ processor with 264 KB on-chip SRAM and supports up to 16 MB of off-chip flash memory for program storage. The CPUs run at 133 MHz and the chip supports a variety of peripherals. RP2040 is the first microcontroller from Raspberry Pi Ltd. You can learn more about the RP2040 microcontroller and the official Raspberry Pi Pico boards from our tutorials.
Getting Started with Raspberry Pi Pico : RP2040 Microcontroller Board – Pinout, Schematic and Programming Tutorial
Specifications
- Dual ARM Cortex-M0+ @ 133MHz
- On-chip PLL allows variable core frequency
- 264kByte high-performance SRAM in six independent banks
- Support for up to 16MB of off-chip Flash memory via a dedicated QSPI bus with eXecute In Place (XIP)
- DMA controller
- Fully-connected AHB crossbar
- Interpolator and integer divider peripherals
- On-chip programmable LDO to generate the core voltage
- 2 on-chip PLLs to generate USB and core clocks
- 30 multi-function General Purpose IO (4 can be used for ADC)
- 1.8-3.3V IO Voltage (NOTE: Pico IO voltage is fixed at 3.3V)
- 12-bit 500ksps Analogue to Digital Converter (ADC)
- Peripherals
- 2 UARTs
- 2 SPI controllers
- 2 I2C controllers
- 16 PWM channels
- USB 1.1 controller and PHY, with host and device support
- 8 PIO state machines
- 2 × Programmable IO (PIO) blocks, 8 state machines total
- Flexible, user-programmable high-speed IO
- Can emulate interfaces such as SD Card and VGA
- QFN-56 7x7mm package
SWD
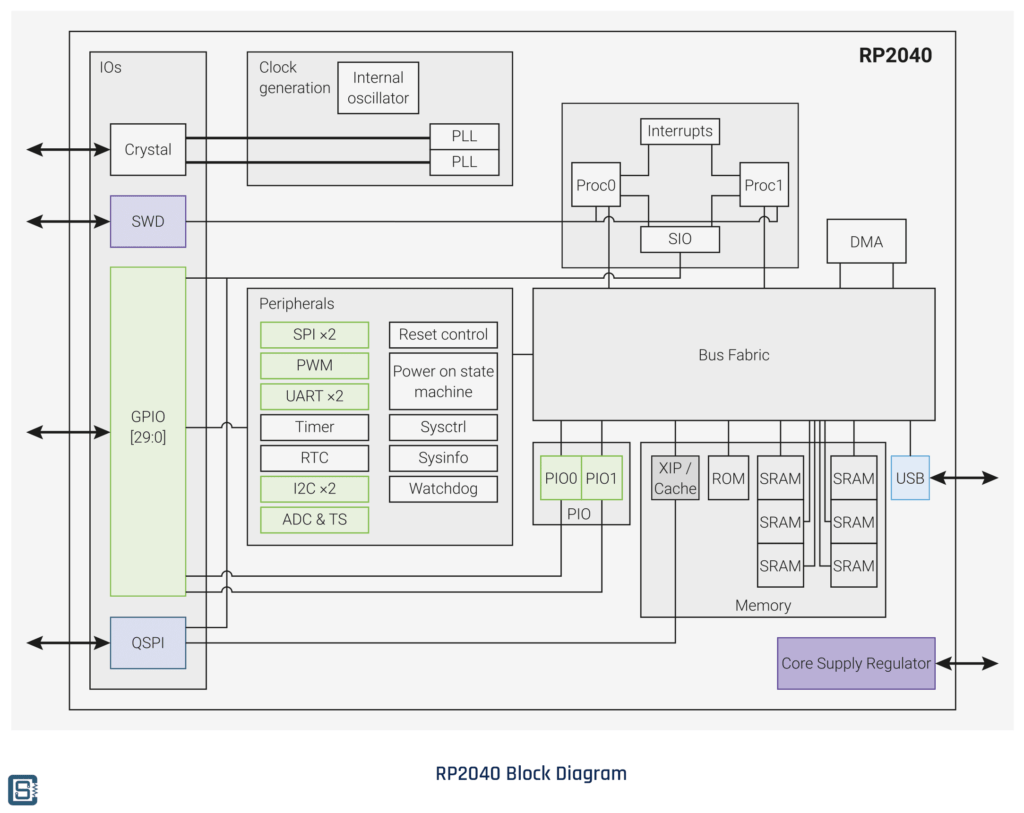
SWD (Serial Wire Debug) is a two-wire bidirectional debug interface exclusively found in ARM controllers. It uses the same JTAG IEEE 1149.1 protocol but only uses two wires (in addition to the GND) for the physical interface instead of 4 in JTAG. This simplifies connection to the target microcontroller from a debug probe. SWD allows you to access the CPU registers, peripheral registers, and memory for real-time inspection and stepping through instructions. The two signals associated with SWD are SWCLK (Clock) and SWDIO (Data In/out). RP2040 integrates an SWD peripheral inside the chip and you can spot it on the internal block diagram. The SWD signals are assigned to dedicated pins on RP2040.
| Name | Pins | Description |
|---|---|---|
| SWCLK | 24 | SWD Clock |
| SWDIO | 25 | SWD Data In and Out |
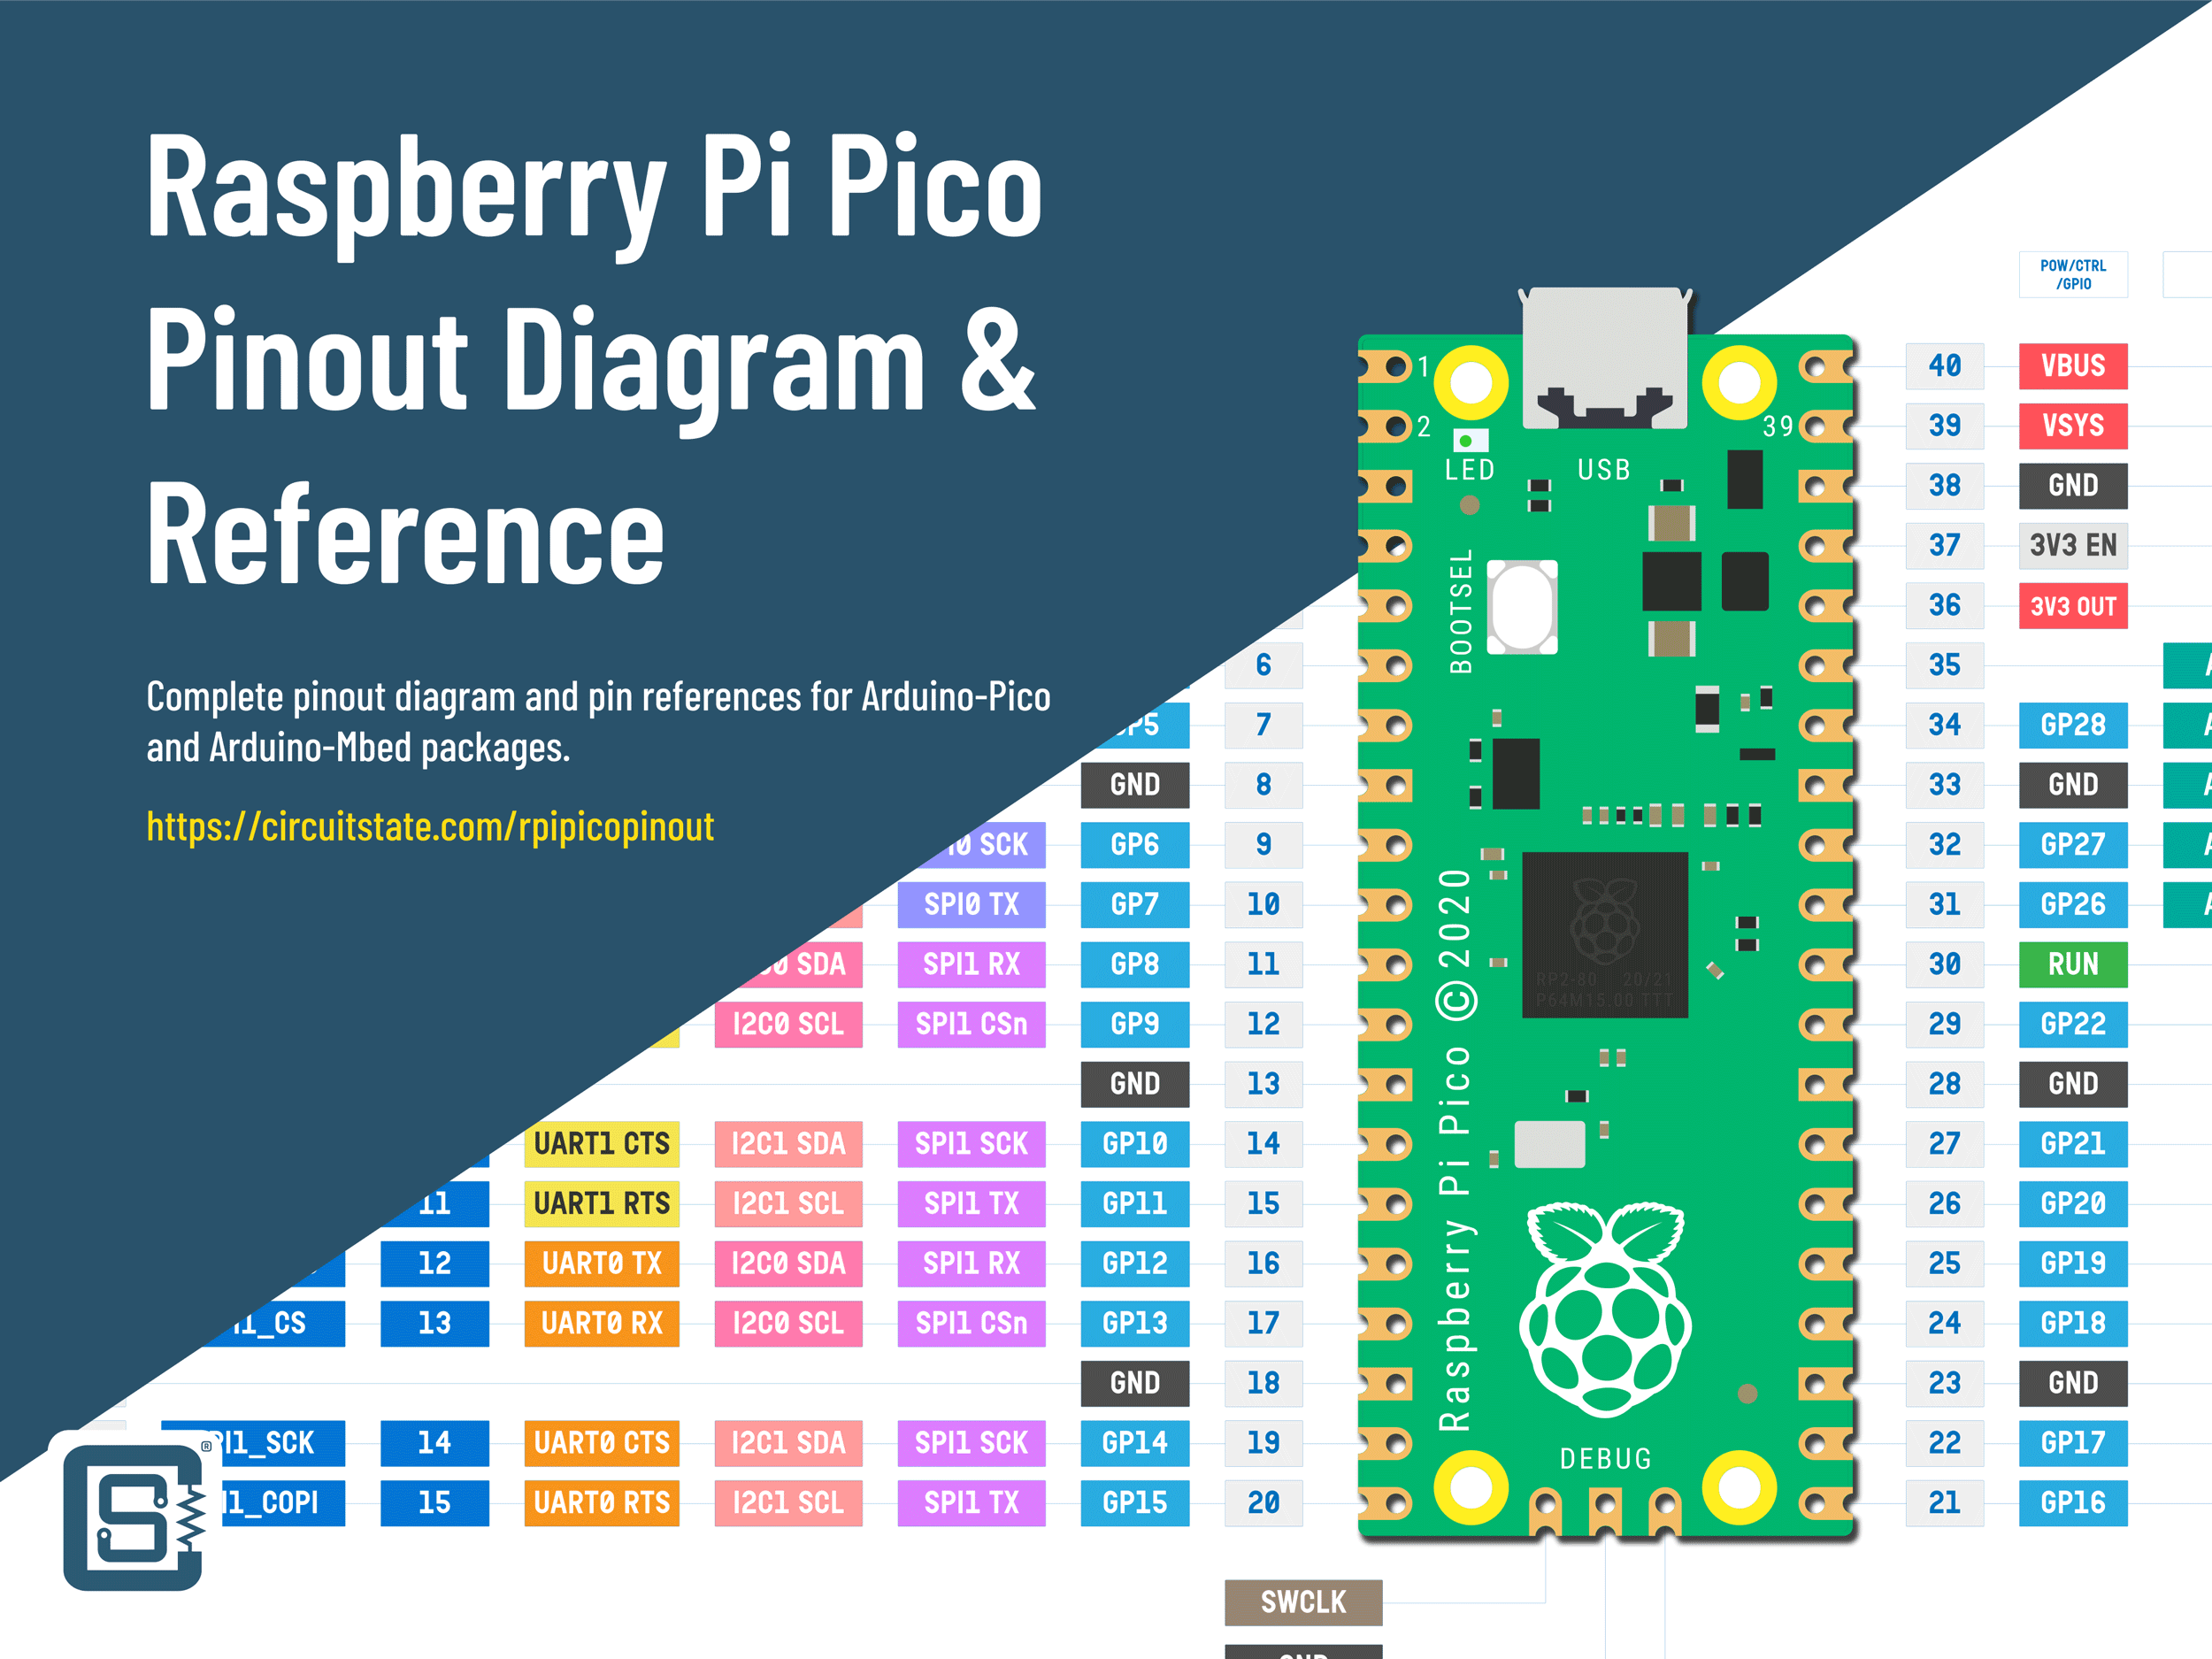
If you need a complete pinout diagram and pin reference for RP2040 and the Raspberry Pi Pico board, please check out the following post.
Raspberry Pi Pico RP2040 Microcontroller Board – Pinout Diagram & Arduino Pin Reference
CMSIS-DAP
CMSIS-DAP (Common Microcontroller Software Interface Standard – Debug Access Port) is an application firmware used for accessing the CoreSight Debug and Trace Unit found in all ARM Cortex controllers. CMSIS is an open-source unified development framework for ARM microcontrollers. It allows developers to write software that works on all ARM controllers seamlessly irrespective of the chip vendor. Similarly, DAP firmware can communicate with all supported microcontrollers for programming and debugging them. DAP firmware can be adapted to vendor-specific tools easily without using any expensive debugging tools such as J-Link from Segger. Sometimes, DAP firmware found in vendor-specific debug probes is limited to that specific vendor’s products and can not be used for ARM controllers from other vendors.
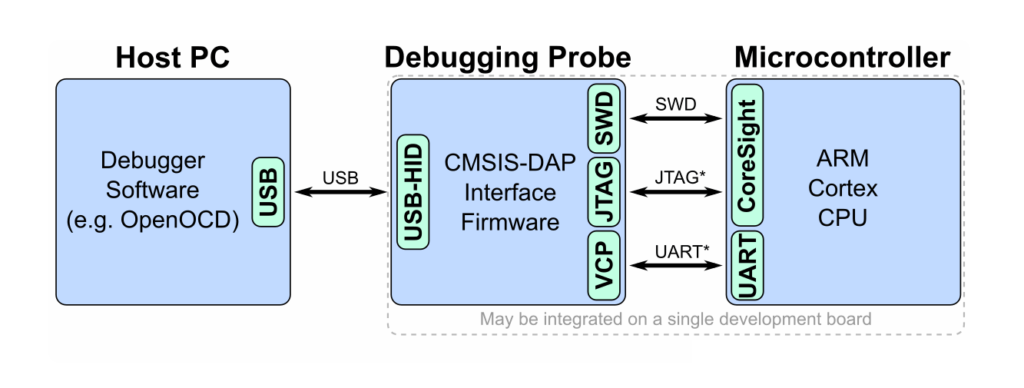
A CMSIS-DAP debug probe comes with a USB for host connection and a JTAG/SWD interface for connecting to the target microcontroller. CMSIS-DAP debug probes can be used for both uploading firmware and debugging. OpenOCD supports CMSIS-DAP debuggers.
OpenOCD
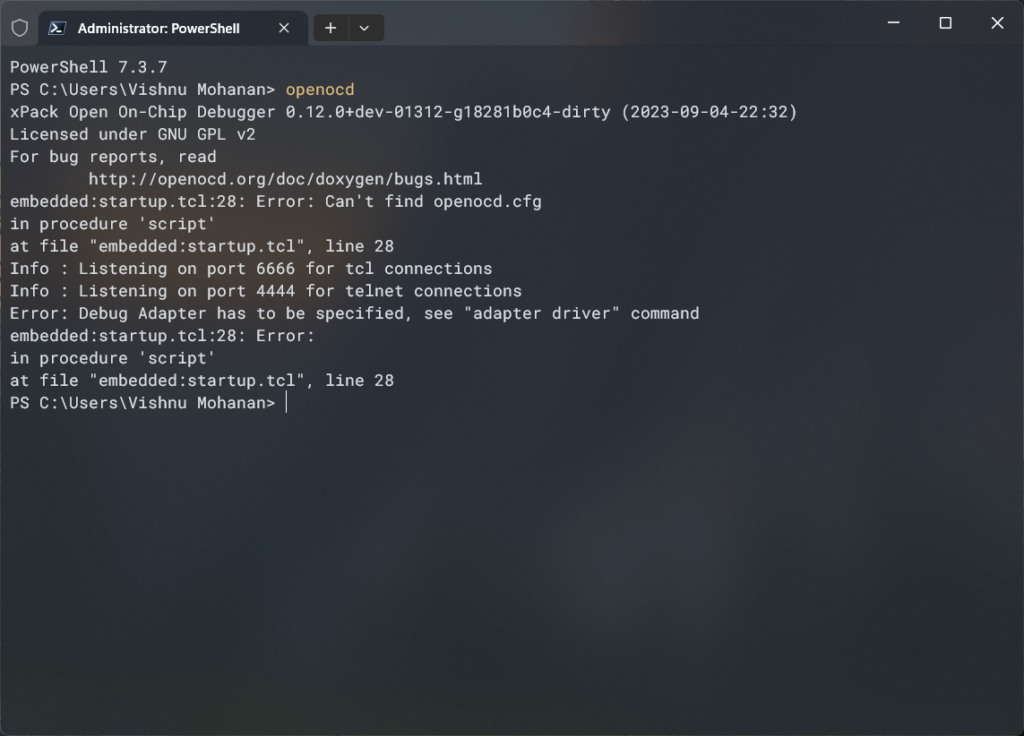
OpenOCD stands for Open On-Chip Debugger and it is a software that was originally created by Dominic Rath that can communicate with the JTAG interface in your microcontroller. OpenOCD is an open-source software and it supports a large variety of debuggers and programmers from different vendors. OpenOCD is a command-line tool and can be invoked from Windows Terminal if installed correctly. You can manually install OpenOCD and add it to the PATH. To check if your system has OpenOCD, you can open the terminal and run the command “openocd”. This will print the version information of OpenOCD if it is present. Otherwise, you will get an unknown command error from the terminal.
OpenOCD is not a standalone debugger. Its main function is to mediate the communication between a debugger and many types of debug adapters and targets. For the actual debugging to happen, a debugger software should interpret the data output by OpenOCD and give the user the necessary controls for debugging the code. We will use GDB as the debugger for this tutorial. Even though OpenOCD and GDB are essential components for the debugging demo presented in this tutorial, we won’t cover them in detail. We will post dedicated tutorials on both of them in the future. For this tutorial, you don’t need to manually install OpenOCD or to have it on your system Path. PlatformIO will take care of downloading all dependencies on its own. Since we are going to use the Arduino-Pico core from earlephilhower, the package already contains versions of OpenOCD, GDB, and the necessary configuration files for debugging RP2040 Arduino projects.
GDB
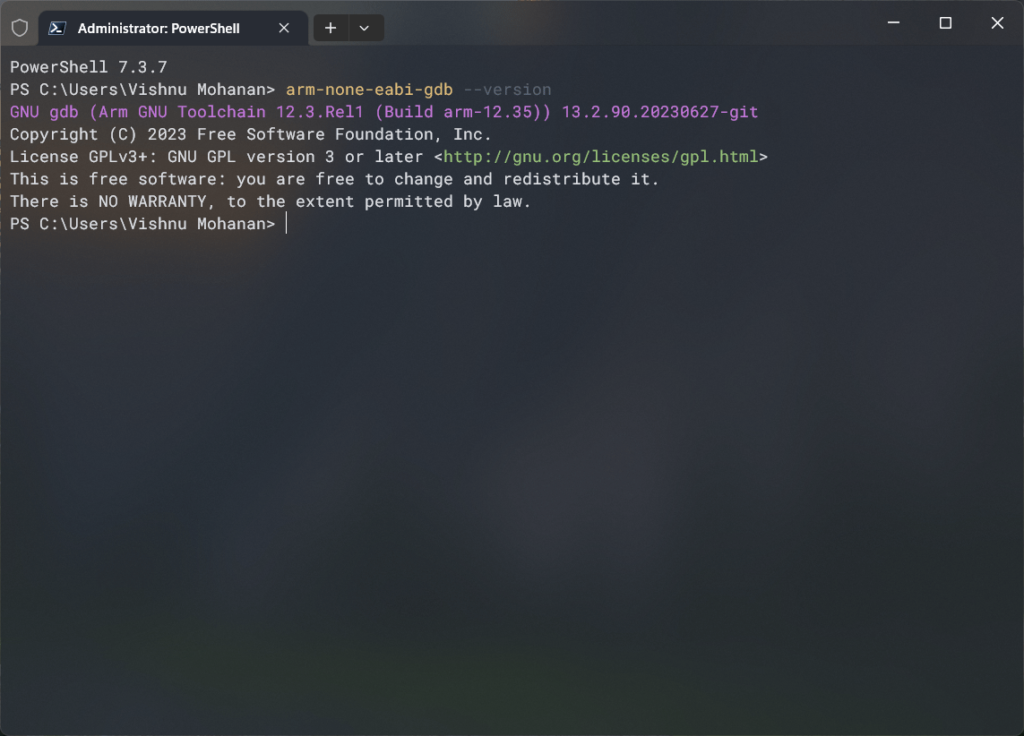
GDB (GNU Debugger) is an open-source debugger software developed by Richard Stallman that is part of the GNU software system. It acts as the front-end for debugging both application software as well as embedded software. GNU can offer native debugging of software targeted for the same hardware GDB is running on, or it can do remote debugging with the actual software running elsewhere. This is how we will incorporate both OpenOCD and GDB in our debugging. OpenOCD can open a GDB server that can accept commands, execute them in the target hardware with the help of a debug adapter, and return the results back to the GDB. To accomplish this GDB must act as a client for remote debugging and communicate with the GDB server opened by OpenOCD. You also don’t need to install GDB on your own. PlatformIO will take care of that.
Raspberry Pi Debug Probe
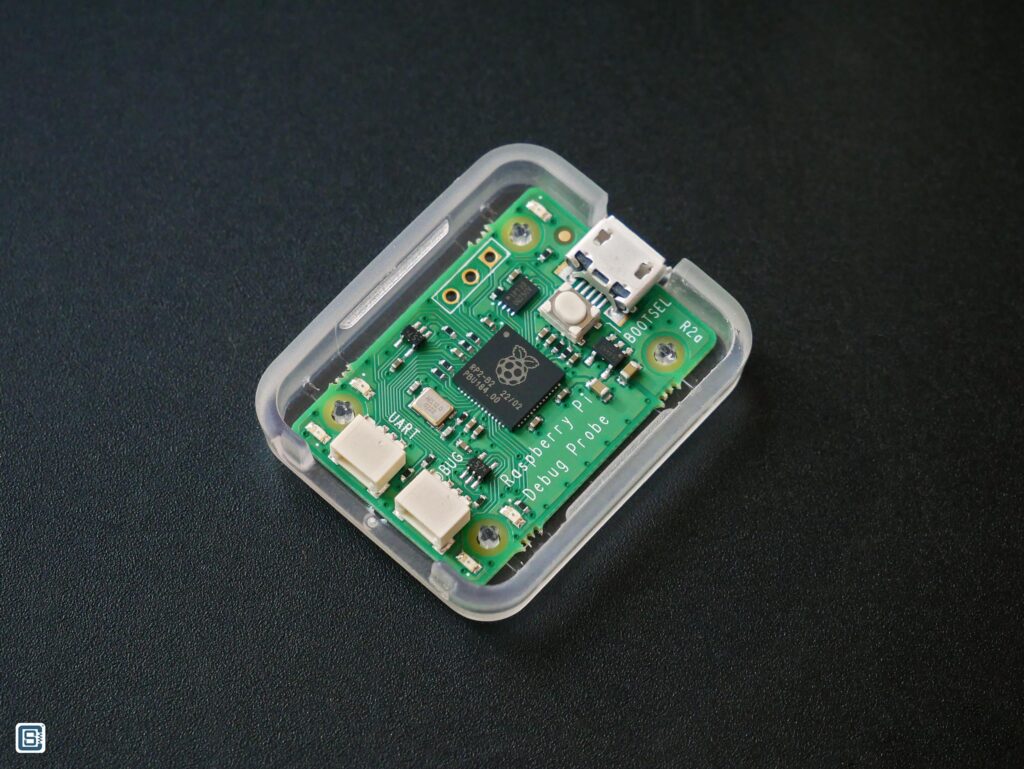
When Raspberry Pi released the RP2040 microcontroller and the Raspberry Pi Pico board on the 21st of January, 2021, they did not come with an official debug probe. You had to use Segger J-Link and other similar expensive tools. It took RPi two years to release an official debug probe on 20th February 2023. But even before that, there were efforts to implement debugging such as the Picoprobe based on CMSIS-DAP. Essentially, you could use one Raspberry Pi Pico to debug another Pico.
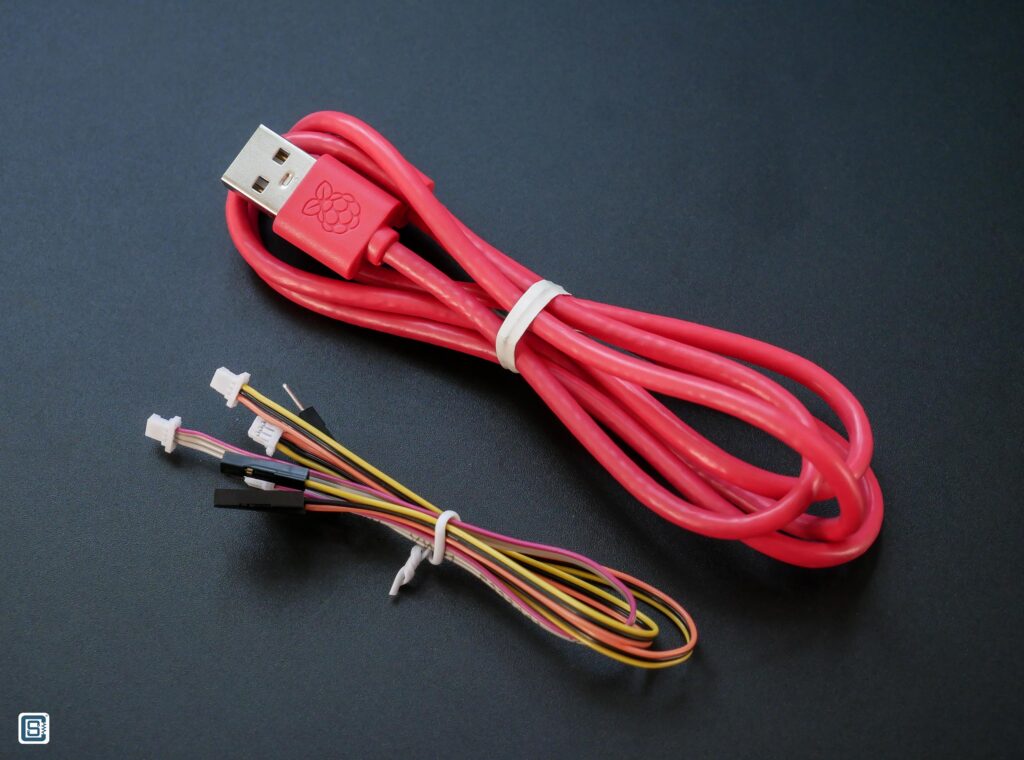
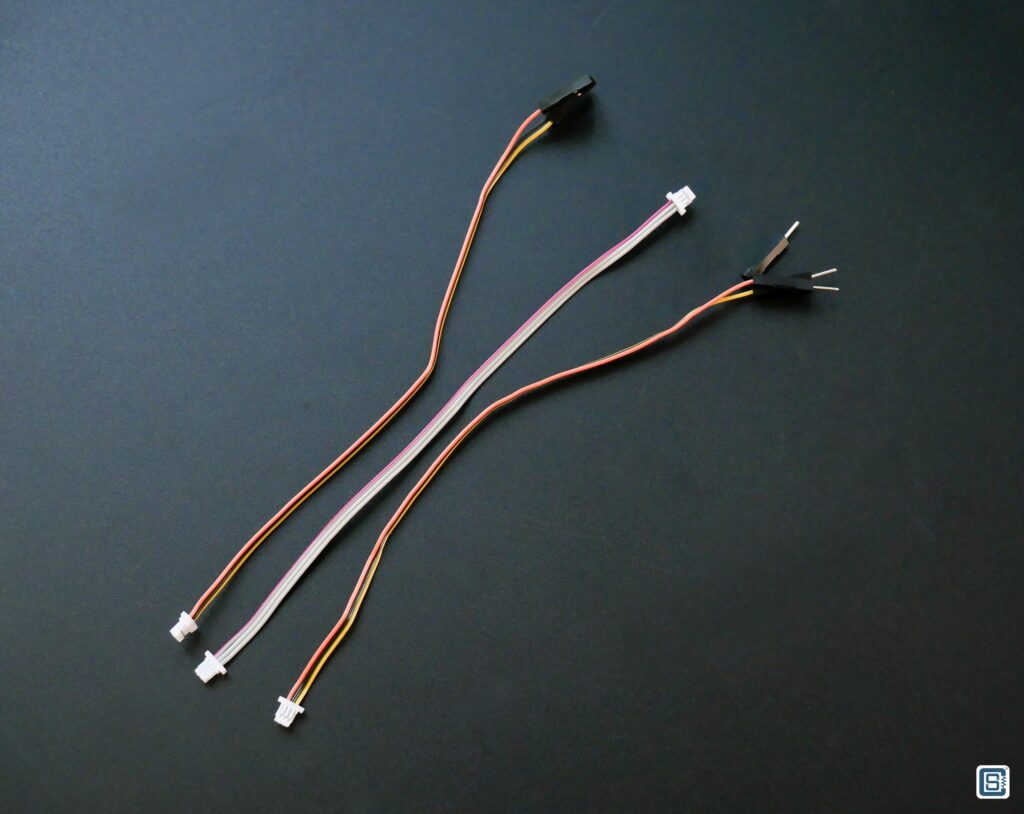
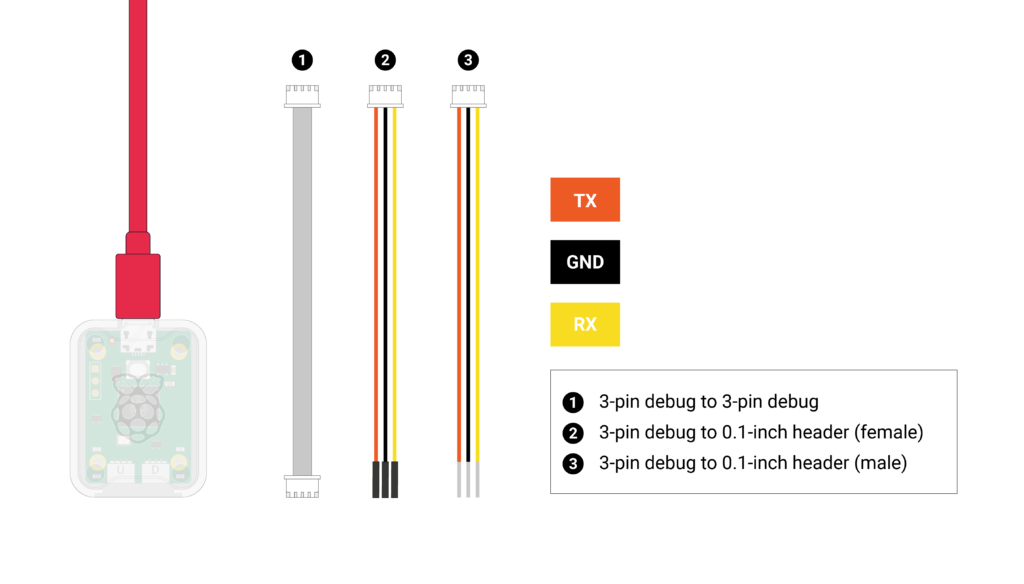
The Raspberry Pi Debug Probe is a dedicated hardware tool based on the Picoprobe firmware. It uses the same RP2040 microcontroller to communicate with a target RP2040 to debug. The Debug Probe exposes one port for SWD and another port for an auxiliary UART port. Both the SWD port and the UART port use 3-pin small JST connectors (SM03B-SRSS-TB). You can use the cables provided in the package to connect to different versions of the Pico board. For example, the Pico H has a JST connector SWD instead of the pin header. The Pico Probe connector interface follows the Raspberry Pi 3-pin Debug Connector Specification.
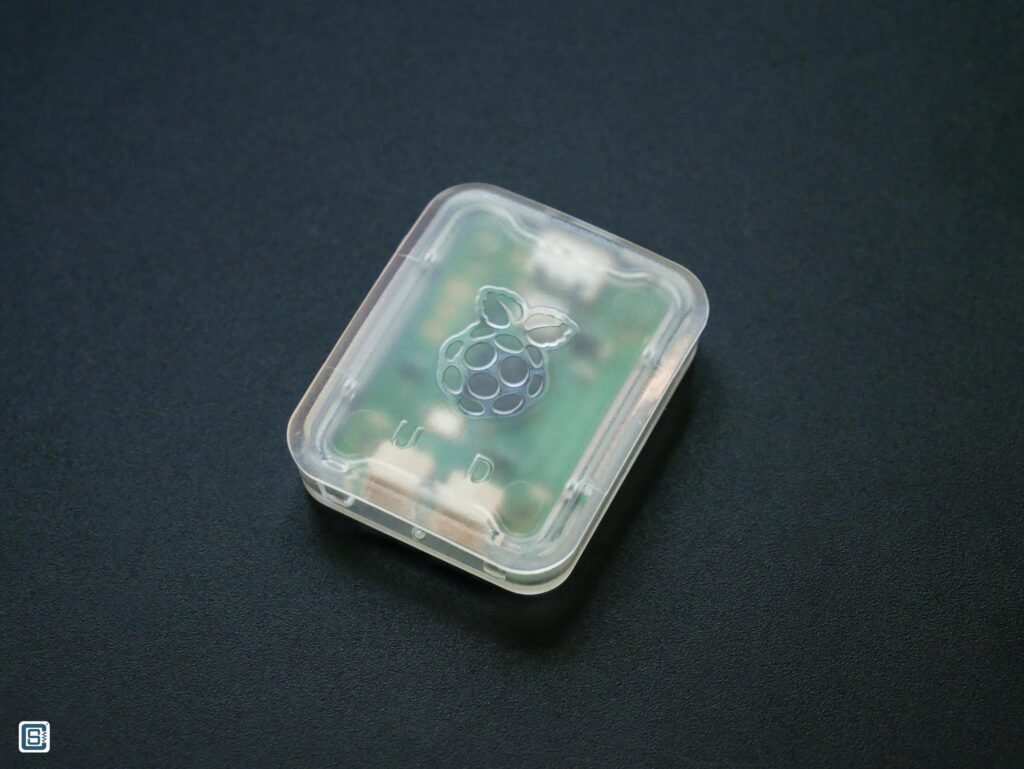
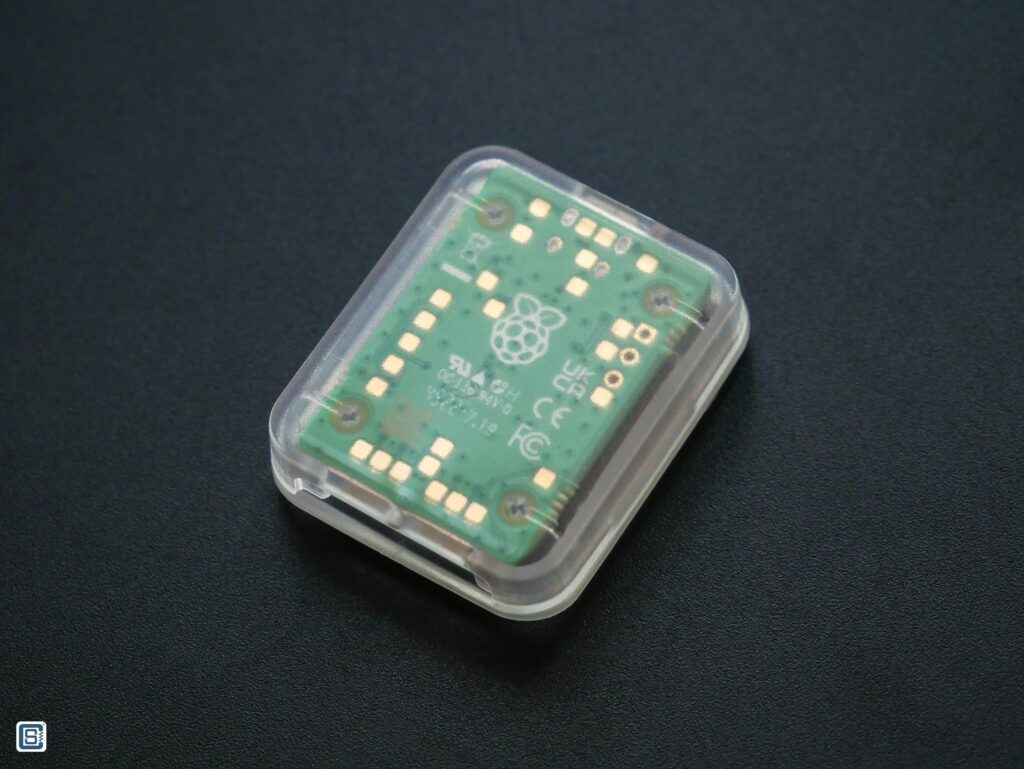
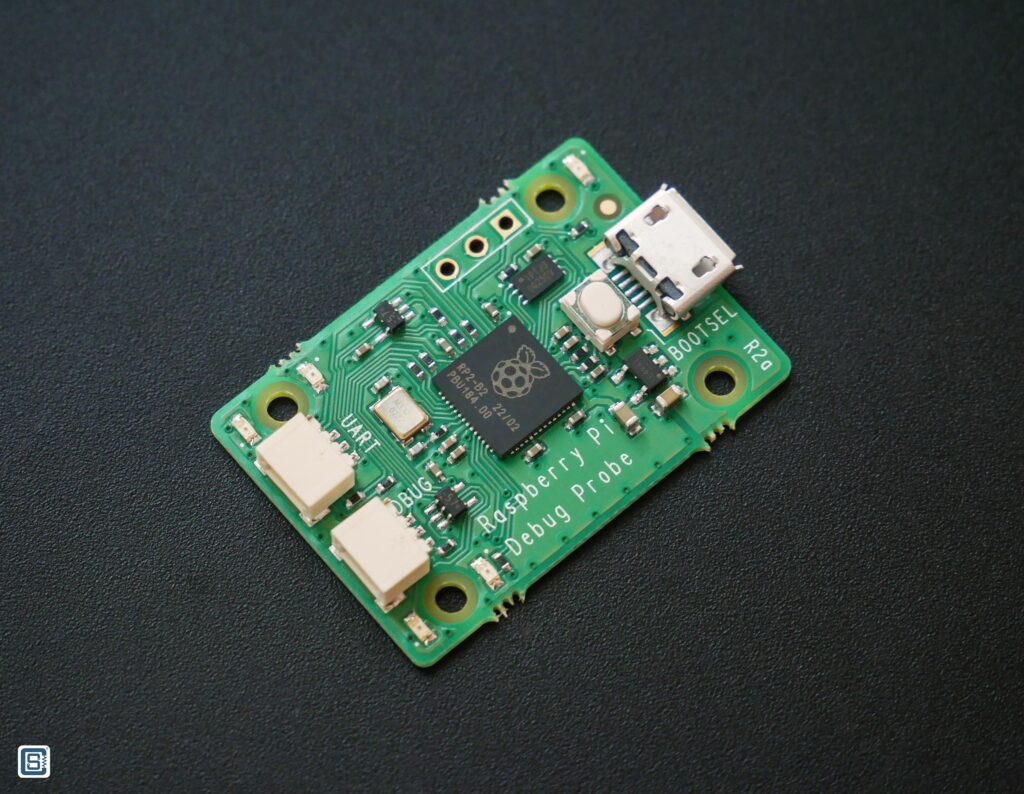
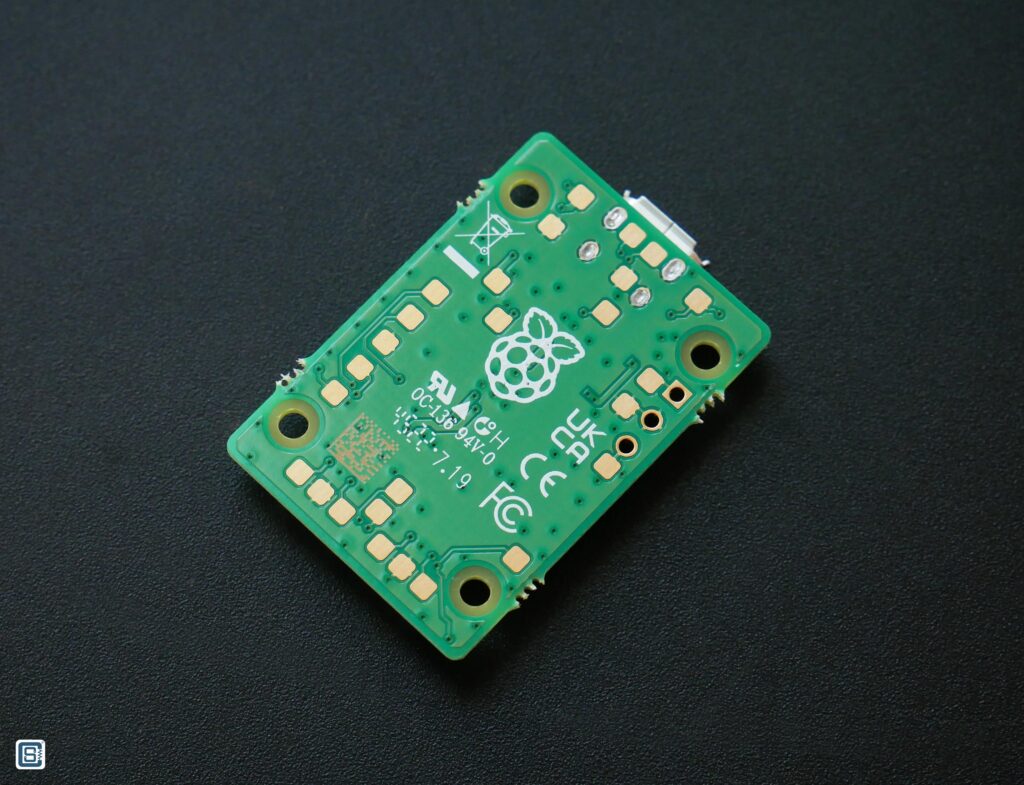
In addition to the JST connectors, the Debug Probe also exposes GPIO0 and GPIO1 of the RP2040. There is also a BOOTSEL button for the RP2040 on the debug probe to update its own CMSIS-DAP firmware. Multiple other signals are broken as test pads and you can find their details on the schematic.
Pinout
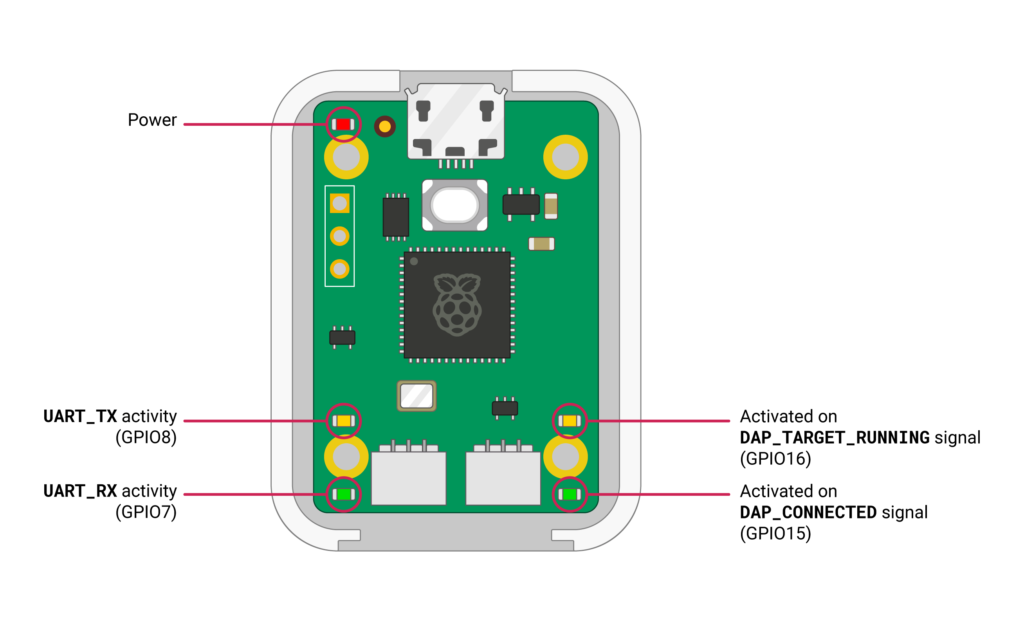
Wiring Diagram
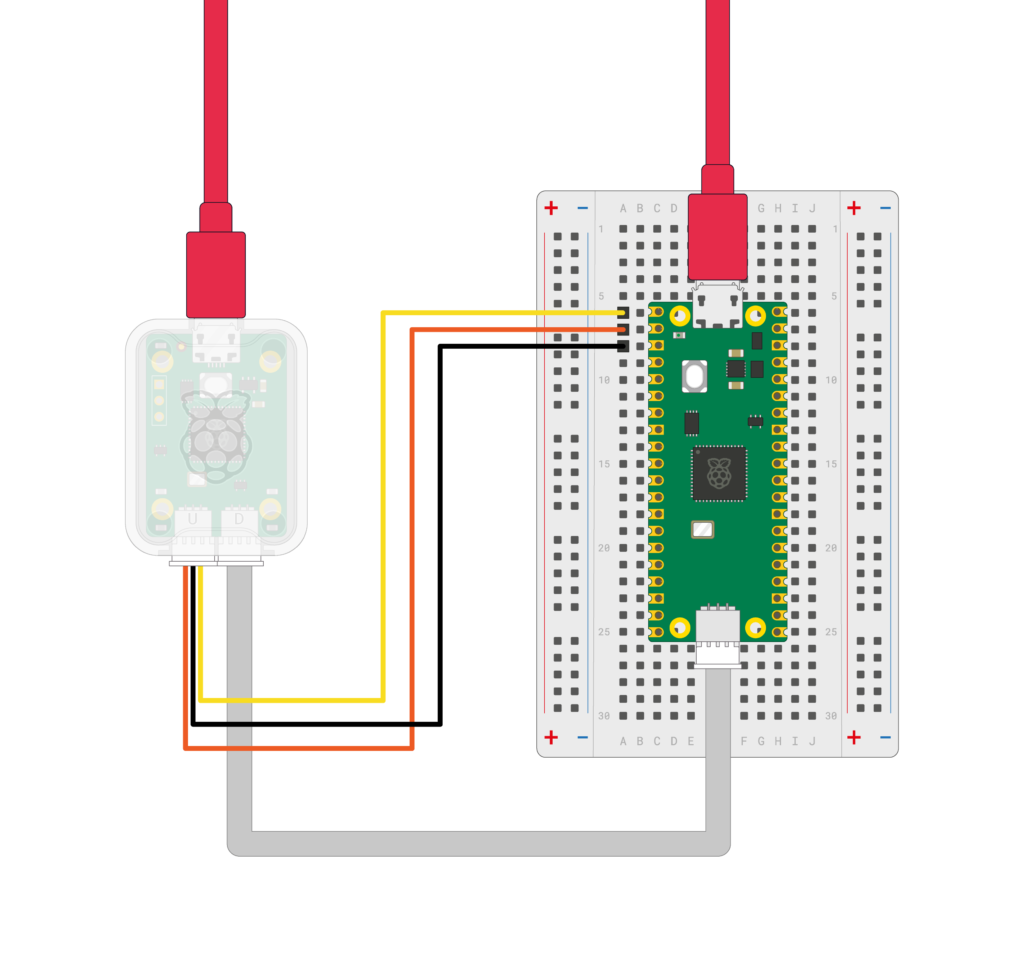
The UART connection is optional here. Since Pico uses the native USB interface for communicating with a computer, the connection is broken every time you upload code. But through the serial port of Pico Debug Probe, you won’t have this issue. It remains always connected and you can direct all your serial debug messages through the UART0 port (or Serial1 port if you are using Arduino).
Schematic
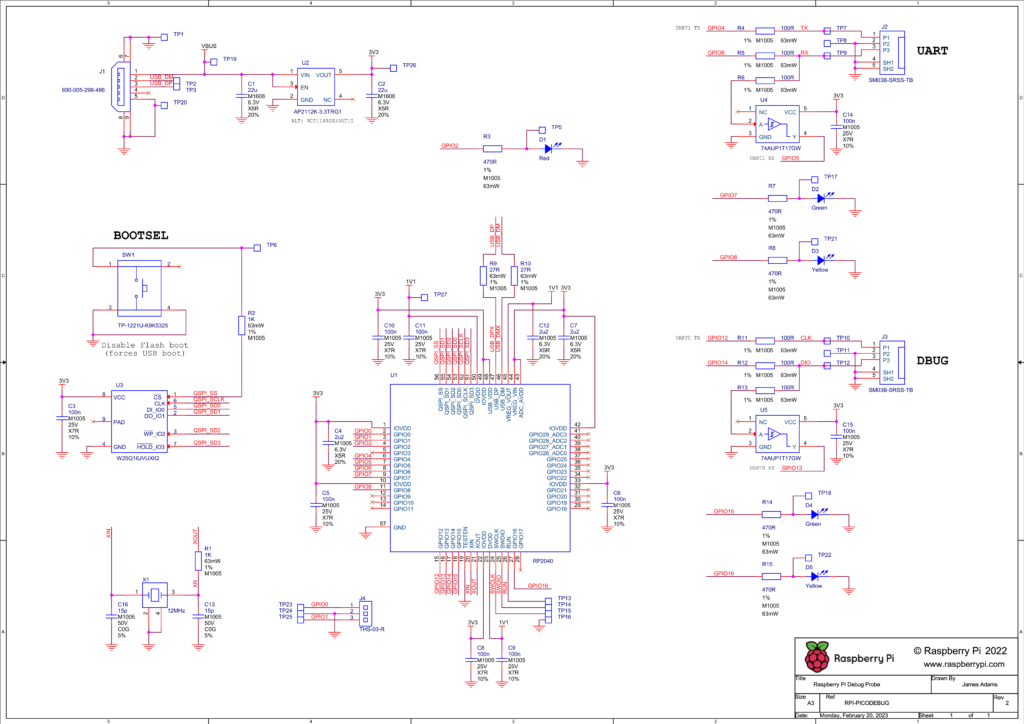
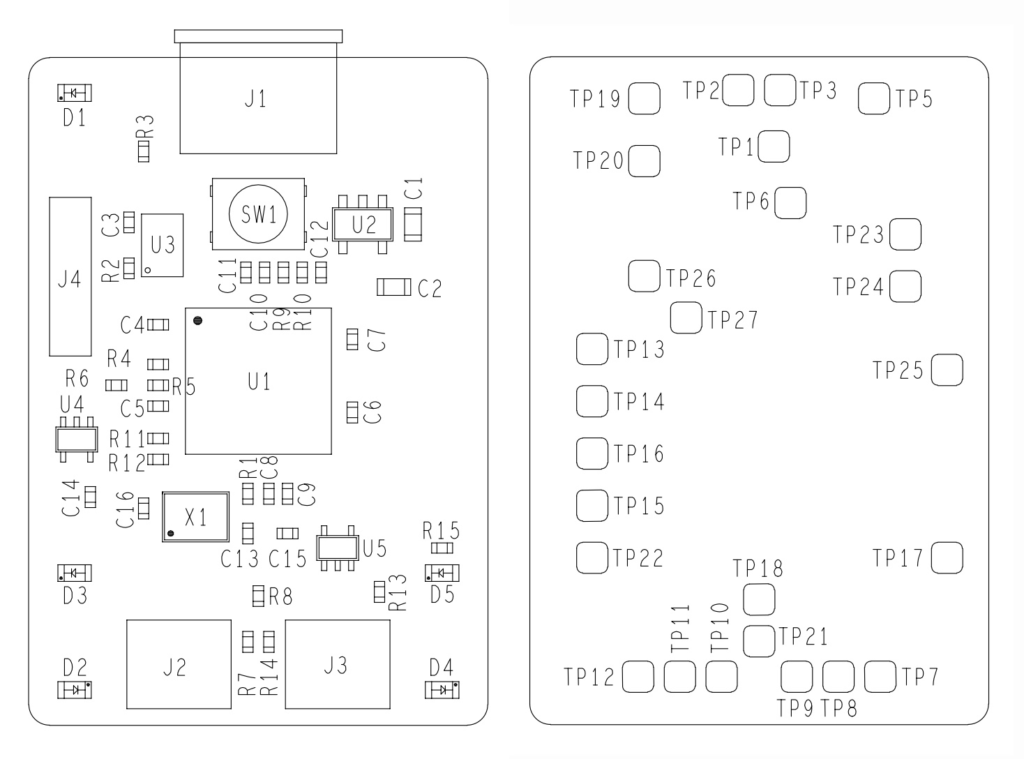
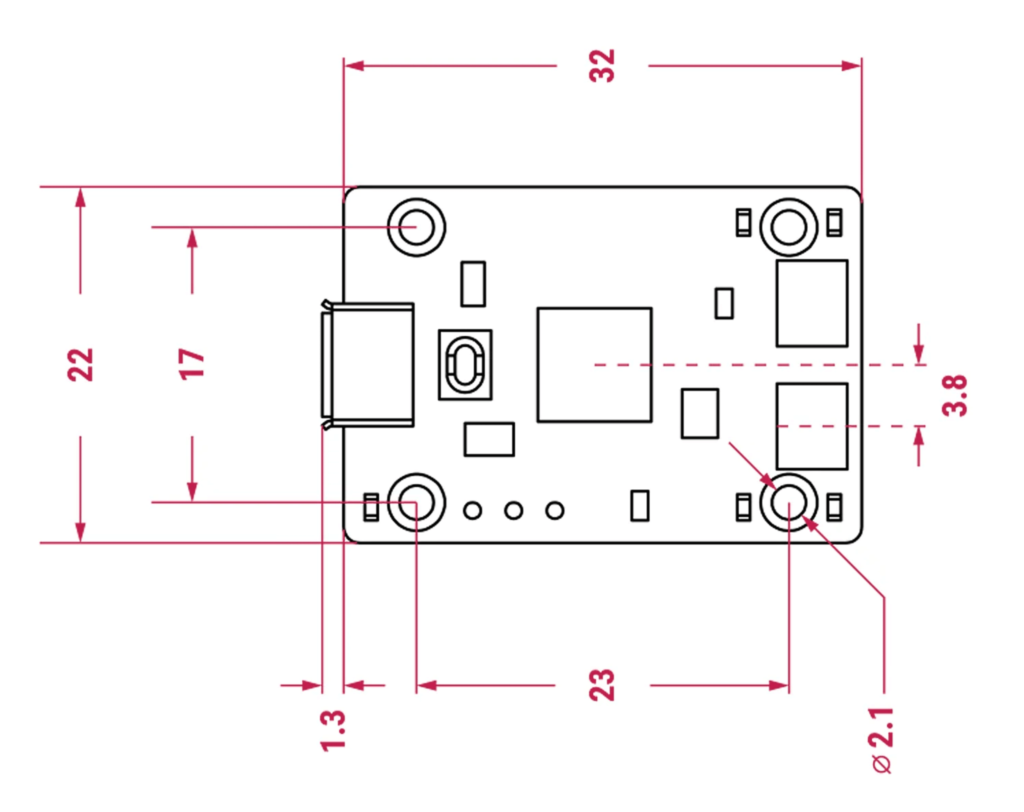
Mechanical Drawing
PlatformIO
If you are unfamiliar, PlatformIO is an open-source unified framework for developing embedded software. It unifies a large number of SDKs, toolchains, frameworks, protocols, processor architectures, programmers, and debuggers into a single platform. PIO makes it extremely easy to develop and debug your embedded projects, without resorting to vendor-specific tools. PIO can be installed as an extension to VS Code and you can create Arduino or ESP-IDF projects with it. You don’t need to install Arduino IDE or Arduino CLI for the PIO extension to work. PIO can install and configure everything for you as long as you have an internet connection. We highly suggest you check out PIO because once you use it, you won’t go back to other tools. We will be using PIO and VS Code for debugging RP2040 projects. To get you started, we have a complete tutorial on PlatformIO which you can find below.
Getting Started with PlatformIO – Unified IDE for Embedded Software Development
VS Code
Visual Studio Code (VS Code) is a free and open-source IDE (Integrated Development Environment) from Microsoft. It is a cross-platform application that runs on all operating systems and browsers. We will use VS Code and its extensions for this tutorial. If you are new to VS Code, we have a great getting started tutorial for you, where we use the Arduino Nano 33 IoT to demonstrate the features and capabilities of VS Code for Arduino development. PlatformIO can be installed on VS Code as an extension.
How to Use VS Code for Creating and Uploading Arduino Sketches
Creating Project
Let’s use PlatformIO and VS Code to create a new project with the Raspberry Pi Pico as the target board and Arduino as the framework. When you create the project, you need an internet connection so that PIO can download all the dependencies. It might take a few minutes to complete downloading depending on your internet speed. We will name our project Blink and add the following code.
#include <Arduino.h>

void setup() {
  pinMode (LED_BUILTIN, OUTPUT);
}

void loop() {
  digitalWrite (LED_BUILTIN, HIGH);
  delay (500);
  digitalWrite (LED_BUILTIN, LOW);
  delay (500);
}We are using the following configuration for PIO. As you can see, we have set the debug_tool and upload_protocol to cmsis-dap to use the Pico Debug Probe that uses the Picoprobe CMSIS-DAP firmware.
[env:pico]
platform = https://github.com/maxgerhardt/platform-raspberrypi.git
board = pico
framework = arduino
board_build.core = earlephilhower
board_build.filesystem_size = 0m
debug_tool = cmsis-dap
debug_speed = 30000
upload_protocol = cmsis-dap
build_type = debugThe maximum adapter speed (debug_speed) you can safely use with the Pico Debug Probe is 30000 bps as per our tests. Above that, the DAP will fail to initialize. Setting the speed higher will make the reading/writing operations of the debug session faster. If you are unable to get your debug adapter working, try lowering the speed. Also make sure that your SWD wires are short and of equal lengths. Long cables will still work, but only at lower speeds.
Building
After adding the code, we can try building (compiling) the project. You can go to the PIO extension tools on the left pane and click the Build button. If everything is installed and configured correctly, the build will be successful and binaries will be saved to the build folder in the root of your project.
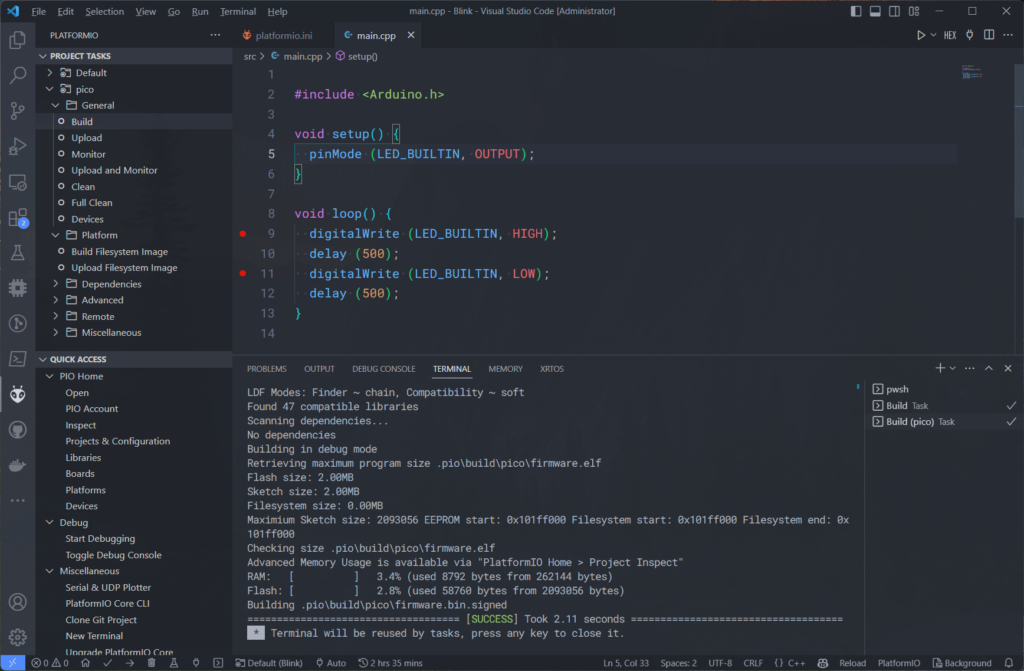
The compilation has to be successful to proceed to the next step. You can now connect the Debug Probe to your Raspberry Pi Pico board using the cables that came in the package. We are using Pico H with a JST connector for the SWD interface. So we can use the JST-to-JST cable here. We have also connected the auxiliary UART port to the Serial1 of the Pico. The Pico Debug Probe’s red LED should turn on when you connect it to the computer.
Debug Probe Driver
When you connect the Debug Probe to your computer, it should create two device instances; one COM port and another CMSIS-DAP v2 interface as you can see from the screenshots below.
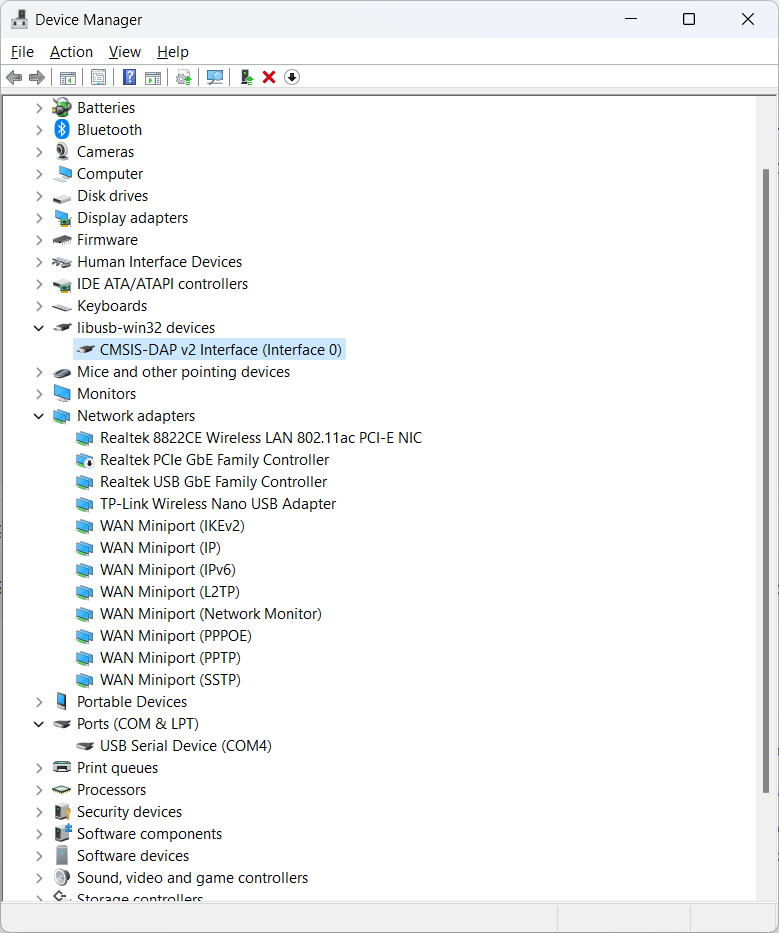
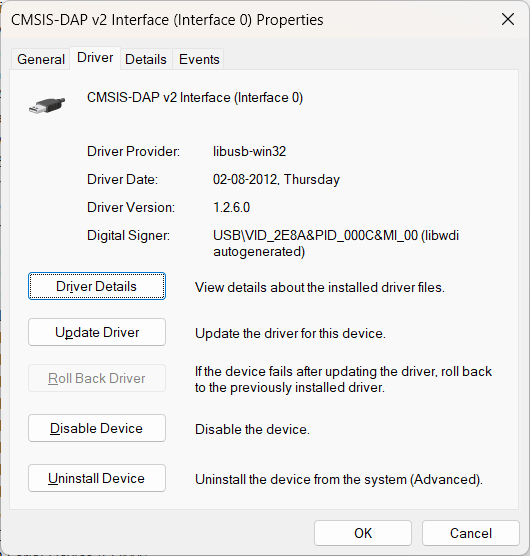
The DAP interface is using the libusb-win32 driver (libusb0 (v1.2.6.0))and the COM port is using the usbser (usbser (v10.0.22621.1830)) driver. If this is not the case and if your system has installed the proper drivers, you can use the Zadig tool to replace the drivers for each of the interfaces with the required ones.
Uploading
After compilation, we can try uploading the firmware to the Pico board. We are using the cmsis-dap protocol here. You can use the following protocols/tools as well.
picotool– for uploading via the native USB interface of the Pico (either in CDC or mass-storage mode).blackmagic– for uploading through the Black Magic Probe (BMP) tool.jlink– for Segger J-Link tools.picoprobe– for Picoprobe supported tools.raspberrypi-swd– if you are using any Raspberry Pi SBC boards.
The upload log for uploading through the cmsis-dap interface is given below. As you can see, the firmware is uploaded successfully.
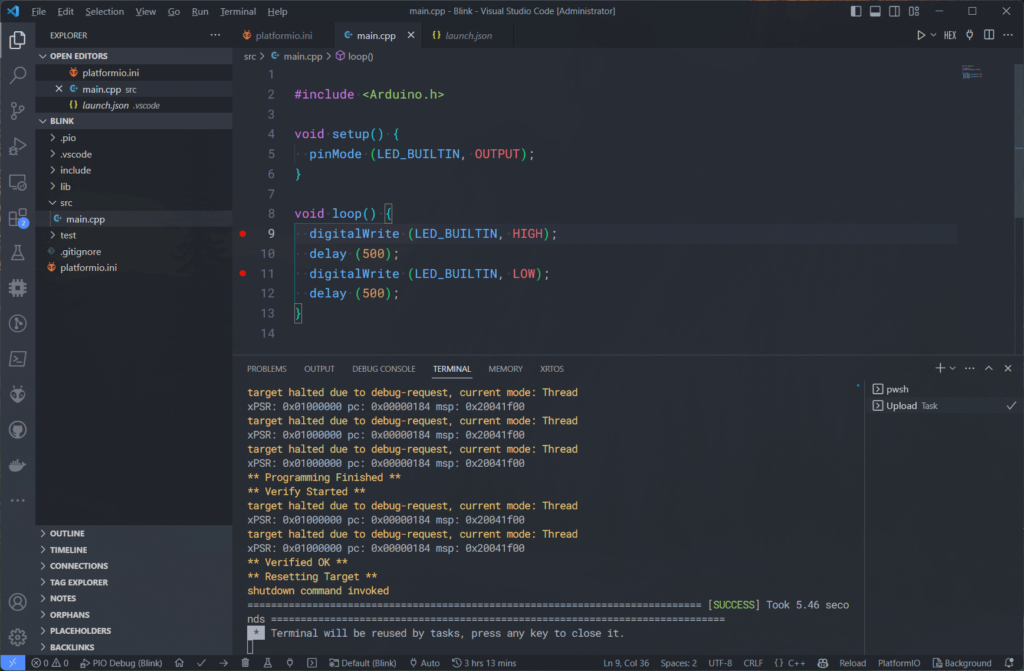
*  Executing task: C:\.PIO\penv\Scripts\platformio.exe run --target upload

Processing pico (platform: https://github.com/maxgerhardt/platform-raspberrypi.git; board: pico; framework: arduino)
----------------------------------------------------------------------------------------------------------------------------------------------------------------------------------------
Verbose mode can be enabled via `-v, --verbose` option
CONFIGURATION: https://docs.platformio.org/page/boards/raspberrypi/pico.html
PLATFORM: Raspberry Pi RP2040 (1.9.0+sha.c0acac7) > Raspberry Pi Pico
HARDWARE: RP2040 133MHz, 264KB RAM, 2MB Flash
DEBUG: Current (cmsis-dap) External (blackmagic, cmsis-dap, jlink, picoprobe, raspberrypi-swd)
PACKAGES:
 - framework-arduinopico @ 1.30202.0+sha.7eb176c
 - tool-mklittlefs-rp2040-earlephilhower @ 5.100300.230216 (10.3.0)
 - tool-openocd-rp2040-earlephilhower @ 5.100300.230216 (10.3.0)
 - tool-rp2040tools @ 1.0.2
 - toolchain-rp2040-earlephilhower @ 5.100300.230216 (10.3.0)
Flash size: 2.00MB
Sketch size: 2.00MB
Filesystem size: 0.00MB
Maximium Sketch size: 2093056 EEPROM start: 0x101ff000 Filesystem start: 0x101ff000 Filesystem end: 0x101ff000
LDF: Library Dependency Finder -> https://bit.ly/configure-pio-ldf
LDF Modes: Finder ~ chain, Compatibility ~ soft
Found 47 compatible libraries
Scanning dependencies...
No dependencies
Building in debug mode
Retrieving maximum program size .pio\build\pico\firmware.elf
Flash size: 2.00MB
Sketch size: 2.00MB
Filesystem size: 0.00MB
Maximium Sketch size: 2093056 EEPROM start: 0x101ff000 Filesystem start: 0x101ff000 Filesystem end: 0x101ff000
Checking size .pio\build\pico\firmware.elf
Advanced Memory Usage is available via "PlatformIO Home > Project Inspect"
RAM:   [          ]   3.4% (used 8792 bytes from 262144 bytes)
Flash: [          ]   2.8% (used 58760 bytes from 2093056 bytes)
Configuring upload protocol...
AVAILABLE: blackmagic, cmsis-dap, jlink, picoprobe, picotool, raspberrypi-swd
CURRENT: upload_protocol = cmsis-dap
Uploading .pio\build\pico\firmware.elf
Open On-Chip Debugger 0.11.0-g228ede43d-dirty (2022-12-22-20:10)
Licensed under GNU GPL v2
For bug reports, read
        http://openocd.org/doc/doxygen/bugs.html
debug_level: 1

adapter speed: 1000 kHz

target halted due to debug-request, current mode: Thread
xPSR: 0xf1000000 pc: 0x000000ea msp: 0x20041f00
target halted due to debug-request, current mode: Thread
xPSR: 0xf1000000 pc: 0x000000ea msp: 0x20041f00
** Programming Started **
target halted due to debug-request, current mode: Thread
xPSR: 0x01000000 pc: 0x00000184 msp: 0x20041f00
target halted due to debug-request, current mode: Thread
xPSR: 0x01000000 pc: 0x00000184 msp: 0x20041f00
target halted due to debug-request, current mode: Thread
xPSR: 0x01000000 pc: 0x00000184 msp: 0x20041f00
target halted due to debug-request, current mode: Thread
xPSR: 0x01000000 pc: 0x00000184 msp: 0x20041f00
target halted due to debug-request, current mode: Thread
xPSR: 0x01000000 pc: 0x00000184 msp: 0x20041f00
target halted due to debug-request, current mode: Thread
xPSR: 0x01000000 pc: 0x00000184 msp: 0x20041f00
target halted due to debug-request, current mode: Thread
xPSR: 0x01000000 pc: 0x00000184 msp: 0x20041f00
target halted due to debug-request, current mode: Thread
xPSR: 0x01000000 pc: 0x00000184 msp: 0x20041f00
target halted due to debug-request, current mode: Thread
xPSR: 0x01000000 pc: 0x00000184 msp: 0x20041f00
target halted due to debug-request, current mode: Thread
xPSR: 0x01000000 pc: 0x00000184 msp: 0x20041f00
target halted due to debug-request, current mode: Thread
xPSR: 0x01000000 pc: 0x00000184 msp: 0x20041f00
target halted due to debug-request, current mode: Thread
xPSR: 0x01000000 pc: 0x00000184 msp: 0x20041f00
target halted due to debug-request, current mode: Thread
xPSR: 0x01000000 pc: 0x00000184 msp: 0x20041f00
target halted due to debug-request, current mode: Thread
xPSR: 0x01000000 pc: 0x00000184 msp: 0x20041f00
target halted due to debug-request, current mode: Thread
xPSR: 0x01000000 pc: 0x00000184 msp: 0x20041f00
** Programming Finished **
** Verify Started **
target halted due to debug-request, current mode: Thread
xPSR: 0x01000000 pc: 0x00000184 msp: 0x20041f00
target halted due to debug-request, current mode: Thread
xPSR: 0x01000000 pc: 0x00000184 msp: 0x20041f00
** Verified OK **
** Resetting Target **
shutdown command invoked
============================================================================= [SUCCESS] Took 5.46 seconds =============================================================================
 *  Terminal will be reused by tasks, press any key to close it.
When we try to upload code through the picoprobe protocol, it fails for some reason. It could be a configuration issue. But since we already have a working interface, let’s worry about that later.
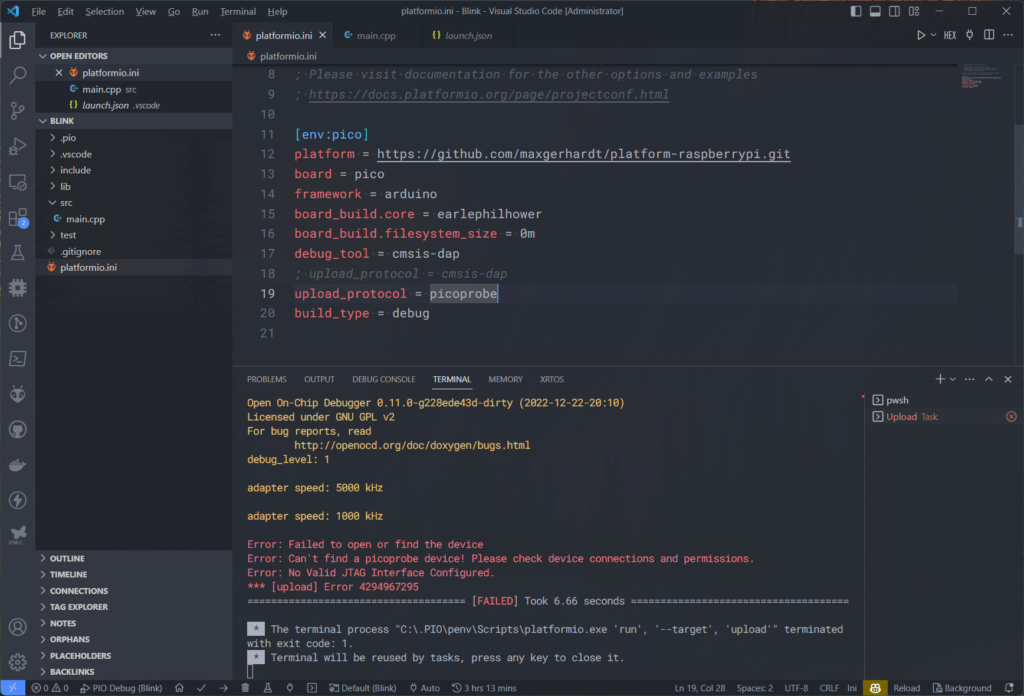
picoprobe * Executing task: C:\.PIO\penv\Scripts\platformio.exe run --target upload
Processing pico (platform: https://github.com/maxgerhardt/platform-raspberrypi.git; board: pico; framework: arduino)
------------------------------------------------------------------------------------------------------
Verbose mode can be enabled via `-v, --verbose` option
CONFIGURATION: https://docs.platformio.org/page/boards/raspberrypi/pico.html
PLATFORM: Raspberry Pi RP2040 (1.9.0+sha.c0acac7) > Raspberry Pi Pico
HARDWARE: RP2040 133MHz, 264KB RAM, 2MB Flash
DEBUG: Current (cmsis-dap) External (blackmagic, cmsis-dap, jlink, picoprobe, raspberrypi-swd)
PACKAGES:
- framework-arduinopico @ 1.30202.0+sha.7eb176c
- tool-mklittlefs-rp2040-earlephilhower @ 5.100300.230216 (10.3.0)
- tool-openocd-rp2040-earlephilhower @ 5.100300.230216 (10.3.0)
- tool-rp2040tools @ 1.0.2
- toolchain-rp2040-earlephilhower @ 5.100300.230216 (10.3.0)
Flash size: 2.00MB
Sketch size: 2.00MB
Filesystem size: 0.00MB
Maximium Sketch size: 2093056 EEPROM start: 0x101ff000 Filesystem start: 0x101ff000 Filesystem end: 0x101ff000
LDF: Library Dependency Finder -> https://bit.ly/configure-pio-ldf
LDF Modes: Finder ~ chain, Compatibility ~ soft
Found 47 compatible libraries
Scanning dependencies...
No dependencies
Building in debug mode
Compiling .pio\build\pico\FrameworkArduinoBootloader\boot2_w25q080_2_padded_checksum.S.o
Compiling .pio\build\pico\src\main.cpp.o
Generating linkerscript D:\Code\PlatformIO\RP2040\Blink\.pio\build\pico/memmap_default.ld
Compiling .pio\build\pico\FrameworkArduino\Bootsel.cpp.o
Compiling .pio\build\pico\FrameworkArduino\CoreMutex.cpp.o
Compiling .pio\build\pico\FrameworkArduino\FS.cpp.o
Compiling .pio\build\pico\FrameworkArduino\RP2040Support.cpp.o
Compiling .pio\build\pico\FrameworkArduino\RP2040USB.cpp.o
Compiling .pio\build\pico\FrameworkArduino\SerialPIO.cpp.o
Compiling .pio\build\pico\FrameworkArduino\SerialUART.cpp.o
Compiling .pio\build\pico\FrameworkArduino\SerialUSB.cpp.o
Compiling .pio\build\pico\FrameworkArduino\StackThunk.cpp.o
Compiling .pio\build\pico\FrameworkArduino\Tone.cpp.o
Compiling .pio\build\pico\FrameworkArduino\WMath.cpp.o
Compiling .pio\build\pico\FrameworkArduino\_freertos.cpp.o
Compiling .pio\build\pico\FrameworkArduino\api\Common.cpp.o
Compiling .pio\build\pico\FrameworkArduino\api\IPAddress.cpp.o
Compiling .pio\build\pico\FrameworkArduino\api\PluggableUSB.cpp.o
Compiling .pio\build\pico\FrameworkArduino\api\Print.cpp.o
Compiling .pio\build\pico\FrameworkArduino\api\Stream.cpp.o
Compiling .pio\build\pico\FrameworkArduino\api\String.cpp.o
Compiling .pio\build\pico\FrameworkArduino\cyw43_wrappers.cpp.o
Compiling .pio\build\pico\FrameworkArduino\delay.cpp.o
Compiling .pio\build\pico\FrameworkArduino\libb64\cdecode.cpp.o
Compiling .pio\build\pico\FrameworkArduino\libb64\cencode.cpp.o
Compiling .pio\build\pico\FrameworkArduino\lock.cpp.o
Compiling .pio\build\pico\FrameworkArduino\lwip_wrap.cpp.o
Compiling .pio\build\pico\FrameworkArduino\main.cpp.o
Compiling .pio\build\pico\FrameworkArduino\malloc-lock.cpp.o
Compiling .pio\build\pico\FrameworkArduino\posix.cpp.o
Compiling .pio\build\pico\FrameworkArduino\sdkoverride\btstack_flash_bank.cpp.o
Compiling .pio\build\pico\FrameworkArduino\sdkoverride\pico_bootsel_via_double_reset.c.o
Compiling .pio\build\pico\FrameworkArduino\stdlib_noniso.cpp.o
Compiling .pio\build\pico\FrameworkArduino\wiring_analog.cpp.o
Compiling .pio\build\pico\FrameworkArduino\wiring_digital.cpp.o
Compiling .pio\build\pico\FrameworkArduino\wiring_private.cpp.o
Compiling .pio\build\pico\FrameworkArduino\wiring_pulse.cpp.o
Compiling .pio\build\pico\FrameworkArduino\wiring_shift.cpp.o
Archiving .pio\build\pico\libFrameworkArduino.a
Indexing .pio\build\pico\libFrameworkArduino.a
Linking .pio\build\pico\firmware.elf
Generating UF2 image
elf2uf2 ".pio\build\pico\firmware.elf" ".pio\build\pico\firmware.uf2"
Retrieving maximum program size .pio\build\pico\firmware.elf
Flash size: 2.00MB
Sketch size: 2.00MB
Filesystem size: 0.00MB
Maximium Sketch size: 2093056 EEPROM start: 0x101ff000 Filesystem start: 0x101ff000 Filesystem end: 0x101ff000
Checking size .pio\build\pico\firmware.elf
Advanced Memory Usage is available via "PlatformIO Home > Project Inspect"
RAM: [ ] 3.4% (used 8792 bytes from 262144 bytes)
Flash: [ ] 2.8% (used 58760 bytes from 2093056 bytes)
Configuring upload protocol...
AVAILABLE: blackmagic, cmsis-dap, jlink, picoprobe, picotool, raspberrypi-swd
CURRENT: upload_protocol = picoprobe
Uploading .pio\build\pico\firmware.elf
Open On-Chip Debugger 0.11.0-g228ede43d-dirty (2022-12-22-20:10)
Licensed under GNU GPL v2
For bug reports, read
http://openocd.org/doc/doxygen/bugs.html
debug_level: 1
adapter speed: 5000 kHz
adapter speed: 1000 kHz
Error: Failed to open or find the device
Error: Can't find a picoprobe device! Please check device connections and permissions.
Error: No Valid JTAG Interface Configured.
*** [upload] Error 4294967295
===================================== [FAILED] Took 6.66 seconds =====================================
* The terminal process "C:\.PIO\penv\Scripts\platformio.exe 'run', '--target', 'upload'" terminated with exit code: 1.
* Terminal will be reused by tasks, press any key to close it. Debugging
You can start debugging from Run → Start Debugging or from the Run & Debug pane on the left. The code will be paused at the entry point to the main() function. When the debug session is active, both DAP_TARGET_RUNNING (Orange) and DAP_CONNECTED (Green) LEDs will light up.
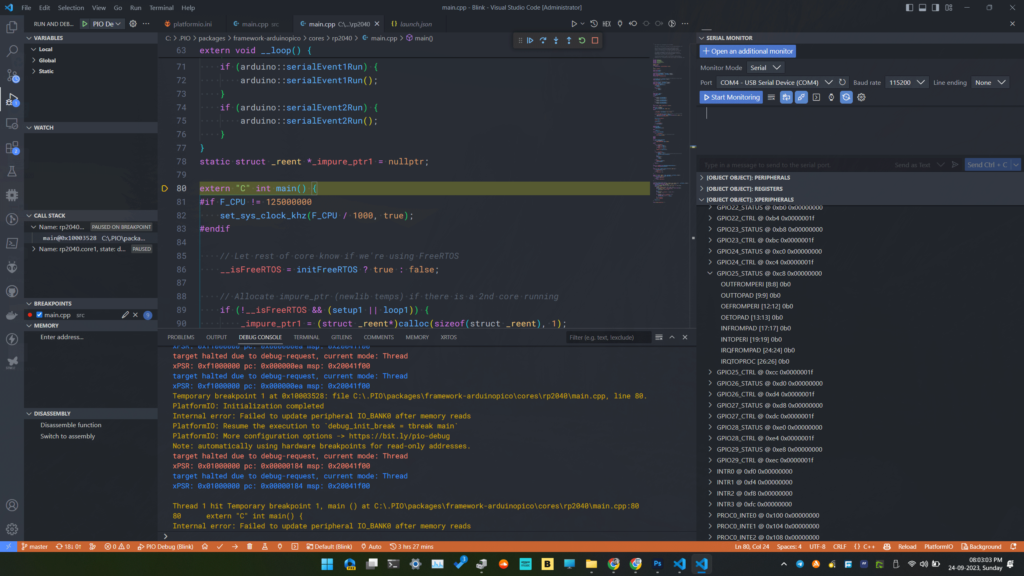
Our launch configuration looks like below. This is automatically created by PIO. Modifying this file will have no effect since it will be rewritten every time.
// AUTOMATICALLY GENERATED FILE. PLEASE DO NOT MODIFY IT MANUALLY
//
// PIO Unified Debugger
//
// Documentation: https://docs.platformio.org/page/plus/debugging.html
// Configuration: https://docs.platformio.org/page/projectconf/section_env_debug.html

{
    "version": "0.2.0",
    "configurations": [
        {
            "type": "platformio-debug",
            "request": "launch",
            "name": "PIO Debug",
            "executable": "D:/Code/PlatformIO/RP2040/Blink/.pio/build/pico/firmware.elf",
            "projectEnvName": "pico",
            "toolchainBinDir": "C:/.PIO/packages/toolchain-rp2040-earlephilhower/bin",
            "internalConsoleOptions": "openOnSessionStart",
            "svdPath": "C:/.PIO/platforms/raspberrypi/misc/svd/rp2040.svd",
            "preLaunchTask": {
                "type": "PlatformIO",
                "task": "Pre-Debug"
            }
        },
        {
            "type": "platformio-debug",
            "request": "launch",
            "name": "PIO Debug (skip Pre-Debug)",
            "executable": "D:/Code/PlatformIO/RP2040/Blink/.pio/build/pico/firmware.elf",
            "projectEnvName": "pico",
            "toolchainBinDir": "C:/.PIO/packages/toolchain-rp2040-earlephilhower/bin",
            "internalConsoleOptions": "openOnSessionStart",
            "svdPath": "C:/.PIO/platforms/raspberrypi/misc/svd/rp2040.svd"
        },
        {
            "type": "platformio-debug",
            "request": "launch",
            "name": "PIO Debug (without uploading)",
            "executable": "D:/Code/PlatformIO/RP2040/Blink/.pio/build/pico/firmware.elf",
            "projectEnvName": "pico",
            "toolchainBinDir": "C:/.PIO/packages/toolchain-rp2040-earlephilhower/bin",
            "internalConsoleOptions": "openOnSessionStart",
            "svdPath": "C:/.PIO/platforms/raspberrypi/misc/svd/rp2040.svd",
            "loadMode": "manual"
        }
    ]
}
Since we have set a single breakpoint on the loop() function, when we press the Continue button, the execution will be paused at that line. You will also hear the Pico being re-enumerated if it is connected to the computer. You can see the peripheral register list on the right side. Currently, they are not updated with actual register values. This is a bug in PlatformIO that doesn’t always correctly load the SVD files of the target.
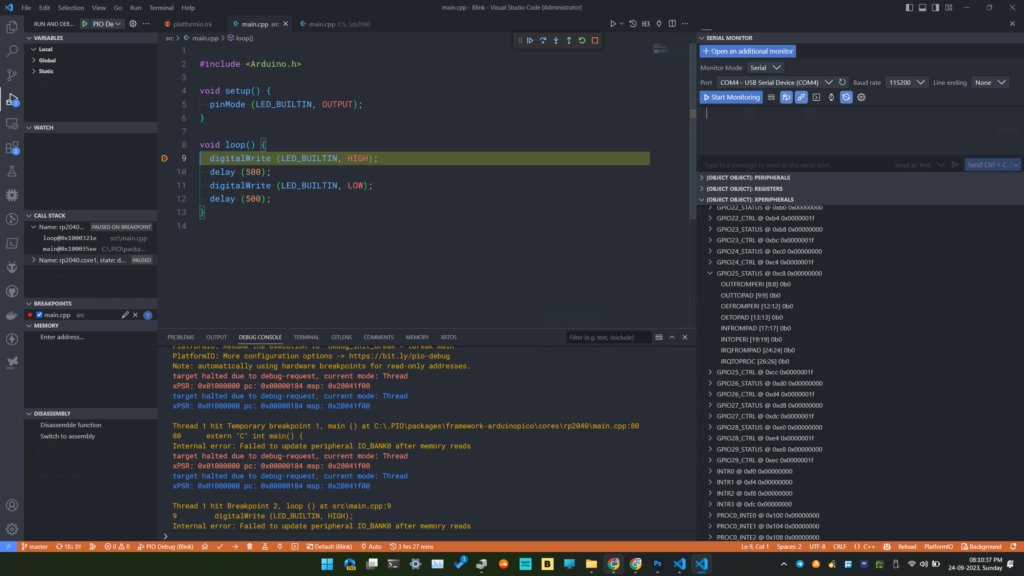
Breakpoint
A breakpoint is simply the location of an instruction (address of the instruction) in your main code where the debugger will halt/pause the CPU. Breakpoints can be hardware or software types. Hardware breakpoints are faster but limited in number. Software breakpoints are directly placed in our code as a breakpoint instruction or flag. You can set breakpoints in VS Code by clicking on the breakpoint button corresponding to a line. In our case, the breakpoint is indicated by a red dot next to the line. You can add multiple breakpoints at different locations in your code. A list of all breakpoints set in the code can be found in the BREAKPOINTS section. You can enable and disable individual or all breakpoints from there, without scrolling through the code.
When a breakpoint is reached, VS Code will move the cursor to the line of code where the current breakpoint is situated. If the file is not open, VS Code will automatically open it for you. In the previous screenshot, the breakpoint was located on line 9 of our code.
Debug Toolbar

To get the code execution to the set breakpoint, we can use the debug toolbar where there are 6 buttons for controlling debugging.
- Continue
- This runs the code until a breakpoint is found. Since the code is currently paused, clicking this button will resume the execution.
- The keyboard shortcut for this function is F5.
- Step Over
- This progresses the execution to the next line in the code from where it is currently paused.
- Only the lines in the main code are stepped through. Subroutines inside libraries are excluded.
- The keyboard shortcut for this function is F10.
- Step Into
- This takes the debugger to the next line inside any subroutines.
- The keyboard shortcut for this function is F11.
- Step Out
- This will exit any subroutines we have previously entered and get us back to the main code.
- The keyboard shortcut for this function is Shift + F11.
- Restart
- This restarts the debugging from the starting point.
- The keyboard shortcut for this function is Ctrl + Shift + F5.
- Stop
- This stops the debugging session.
- The keyboard shortcut for this function is Shift + F5.
Variable Inspection
Just pausing the CPU on some lines of code won’t be of much use. You need to be able to check the values of the variables, hardware registers, and other memory locations. You can do that with the VARIABLES section. It will list all the global and local variables available in the current scope and their values. If you want to monitor a particular variable, you can add that to a watch list shown by the WATCH section.
In addition to viewing the variable values, you can also change their values manually. You can right-click on a variable on the VARIABLES list and use the Set Value option to set a new value to the variable. This will have an immediate effect on your code.
Call Stack
The next thing you can observe on the IDE is the CALL STACK which lists the chain of function calls, their addresses, locations in the file, and states. You can individually step through the functions if needed.
Register Inspection
If you want to see the values of the internal hardware registers of RP2040, you can find them in the REGISTERS section. This only contains the CPU-related registers. Registers related to the peripherals can be found in the PERIPHERALS section. Unfortunately, the peripheral registers (GPIO, I2C, SPI, etc.) are not visible at the moment due to an issue with PlatformIO.
Assembly View
Finally, you can switch to the disassembly view and have a look at the actual machine codes that are being executed. Clicking the Switch to assembly option in the DISASSEEMBLY section will take you to the .dbgasm files.
Flash Dump
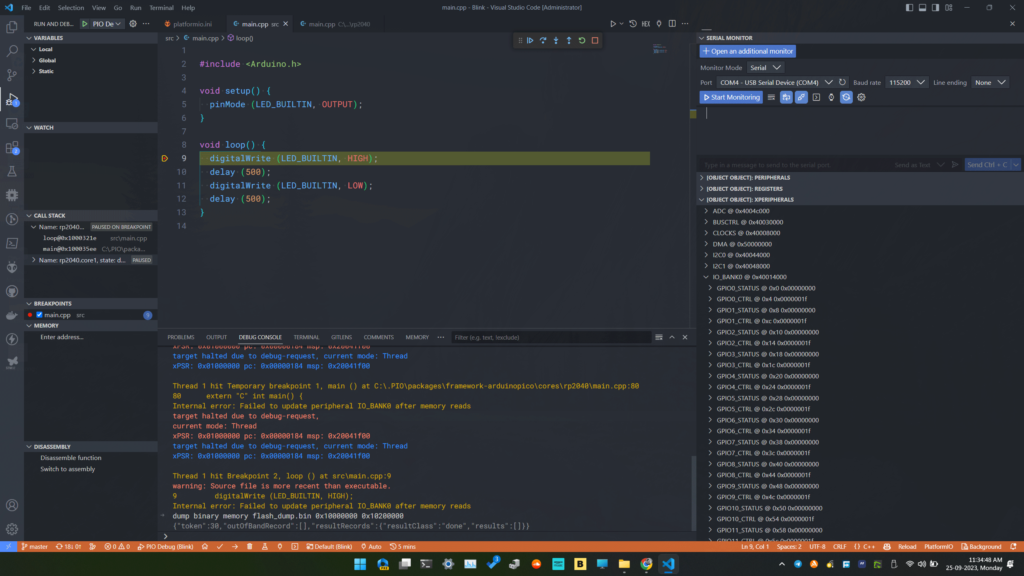
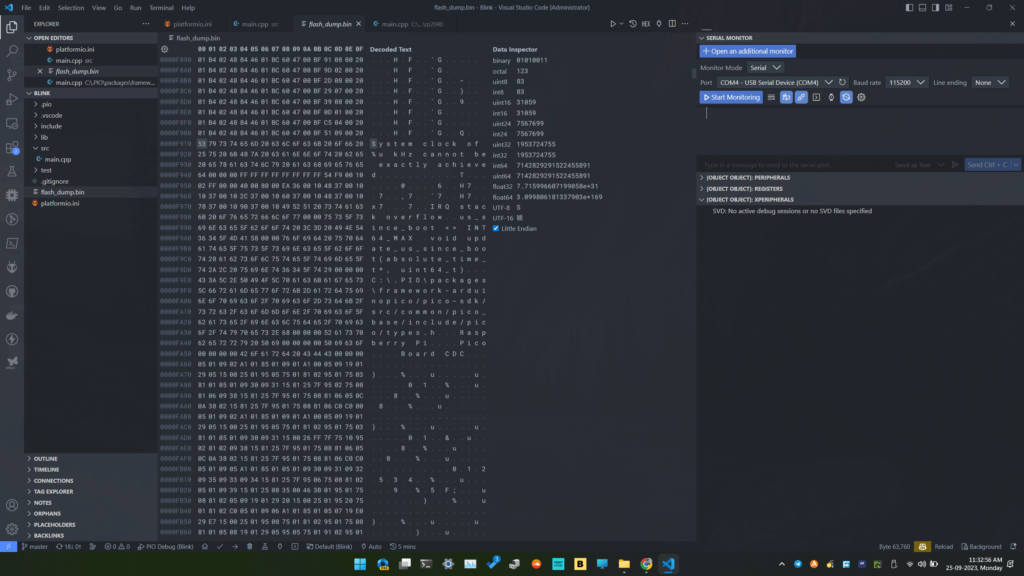
You can use the Debug Console to execute GDB commands. To save the contents of the flash memory you can use the following command while the debug session is active. The starting address of the flash memory is 0x10000000 according to the RP2040 datasheet. So if you have 2 MB of flash memory, the end address would be 0x10200000. This will save the flash contents as a binary file named flash_dump.bin with a file size of 2 MB. If saved correctly, the file will have the same contents as the firmware.bin generated by PlatformIO.
dump binary memory flash_dump.bin 0x10000000 0x10200000It takes around 30 seconds to save the flash contents if the adapter speed (debug_speed) is 10000 bps. The maximum speed you can safely use is 30000 bps as per our tests. Above that, the DAP will fail to initialize.
Troubleshooting
We hope this tutorial was helpful to you. If you have suggestions for improving this tutorial, please let us know in the comments. Happy debugging 🐞
Links
- Raspberry Pi Debug Probe – Product Page
- Raspberry Pi Debug Probe product brief [PDF]
- Raspberry Pi Debug Probe – Official Documentation
- Getting Started with Raspberry Pi Pico : RP2040 Microcontroller Board – Pinout, Schematic and Programming Tutorial
- How to Use VS Code for Creating and Uploading Arduino Sketches
- Raspberry Pi Pico RP2040 Microcontroller Board – Pinout Diagram & Arduino Pin Reference
- JTAG – Wikipedia
- CMSIS-DAP – Official Documentation
- SWD – Documentation
- CoreSight Debug and Trace Unit – ARM Developer Documentation
- CMSIS 5 – GitHub
- OpenOCD – Homepage
- Arduino-Pico Core – GitHub
- Picoprobe – GitHub
- JST SM03B-SRSS-TB – DigiKey
- Raspberry Pi 3-pin Debug Connector Specification [PDF]
- PlatformIO – Homepage
- Zadig – USB Driver Tool
Short Link
- Short URL to this page – https://www.circuitstate.com/picodebugprobepio






Thank you for this detailed, precise, and clear article. I was unable to find much information on setting up a debug probe (the official ones or a “picoprobe” made with another Pi Pico), and I felt a bit lost. Your article was a lifesaver in this regard.
However, it did not work for me right out of the box, leading me to spend a few hours on additional testing and web crawling for more information.
The first point may be obvious:
For the connection between the probe and the Pi Pico, if you do not have a Pi Pico H like me, you must use the Dupont connector. You have three wires (I have not yet connected the UART part of the debugger). Yellow is labeled SD and Orange is labeled SC, black is ground. On the Pico, you also have three pins for connection labeled (under the board) SWDIO, GND, SWCLK. Obviously, you connect the two grounds together. As for the other cables:
SD (the yellow one), which means something like “SWD Data,” and you connect it to SWDIO on the Pico (which stands for SWD Input Output).
SC (the orange one), which means something like “SWD Clock,” and you connect it to SWCLK on the Pico.
The second point is more subtle. I initially copied and pasted your
platform.iniconfiguration:[env:pico]platform = https://github.com/maxgerhardt/platform-raspberrypi.git
board = pico
framework = arduino
board_build.core = earlephilhower
board_build.filesystem_size = 0m
debug_tool = cmsis-dap
debug_speed = 30000
upload_protocol = cmsis-dap
build_type = debug
But the upload (and hence debugging) was not working. I received the error:
Error: Failed to connect multidrop rp2040.dap0.Looking in detail at your terminal output during the upload and comparing it to mine, I noticed that you actually used 1000 kHz for your debug speed. Consequently, I changed theplatform.iniconfiguration to:[env:pico]platform = https://github.com/maxgerhardt/platform-raspberrypi.git
board = pico
framework = arduino
board_build.core = earlephilhower
board_build.filesystem_size = 0m
debug_tool = cmsis-dap
debug_speed = 1000
upload_protocol = cmsis-dap
build_type = debug
And everything works fine!
Thanks Mat, for your detailed feedback. Your feedback can help other readers having similar issues. While we try our best everything, we might miss a few details or uncommon problems.
You are right about the wiring. Since the SWD interface is only a 3-pin one, it is easy to identify the pins. For space saving, SWDIO is shortened to
SDand SWDCLK toSCin some designs.Regarding the speed of the debug adapter, the working speed can vary depending on your setup. We were successful with a mximum of 30KHz. But it will have to be lowered for longer wiring. It is recommended to keep the SWD wires short and equal length. We will add this information to the Troubleshooting section.